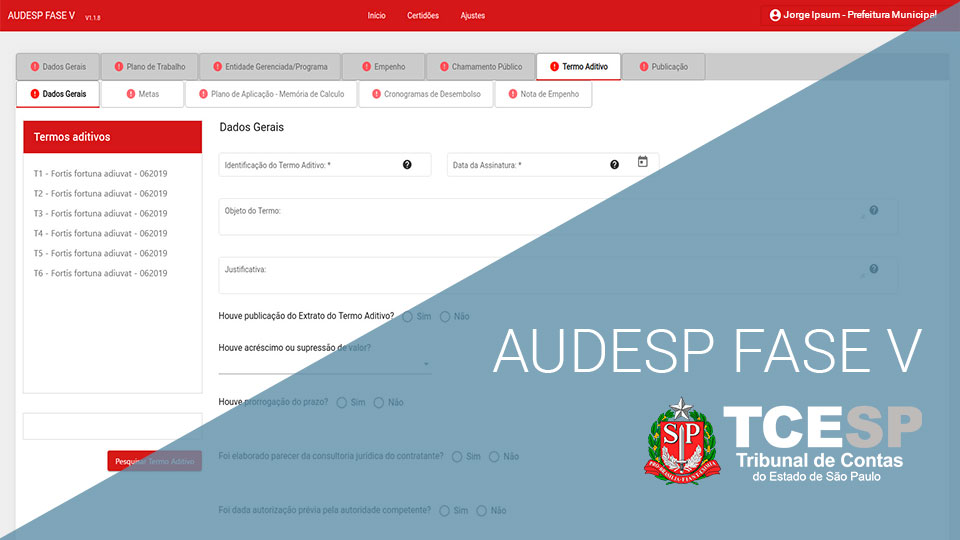
TCESP - AUDESP PHASE V
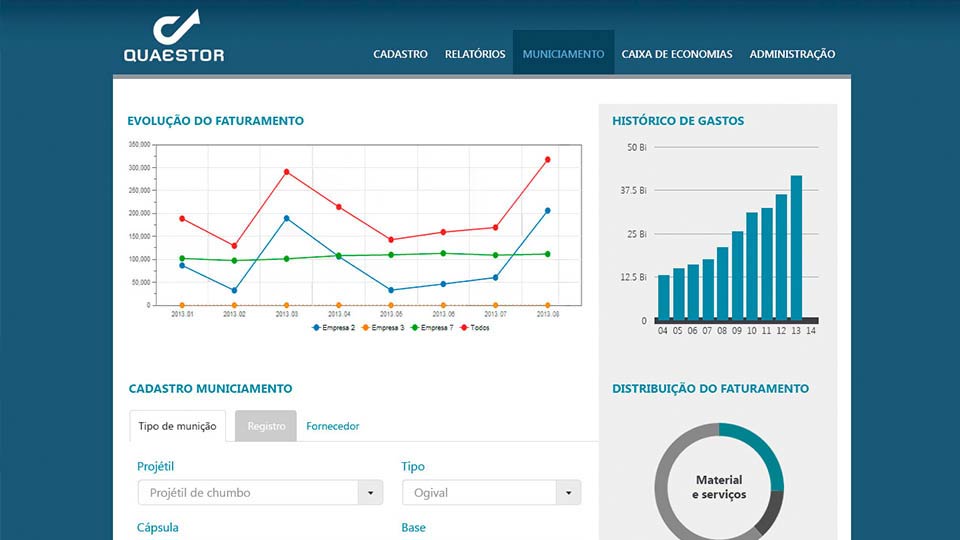
We developed a tool that makes municipal management activities easier and faster. The project's goal is to give TCESP auditors a tool that supports and streamlines their day-to-day work.
We developed a tool that makes municipal management activities easier and faster. The project's goal is to give TCESP auditors a tool that supports and streamlines their day-to-day work.
We developed a tool that makes municipal management activities easier and faster. The project's goal is to give TCESP auditors a tool that supports and streamlines their day-to-day work.
We developed a tool that makes municipal management activities easier and faster. The project's goal is to give TCESP auditors a tool that supports and streamlines their day-to-day work.
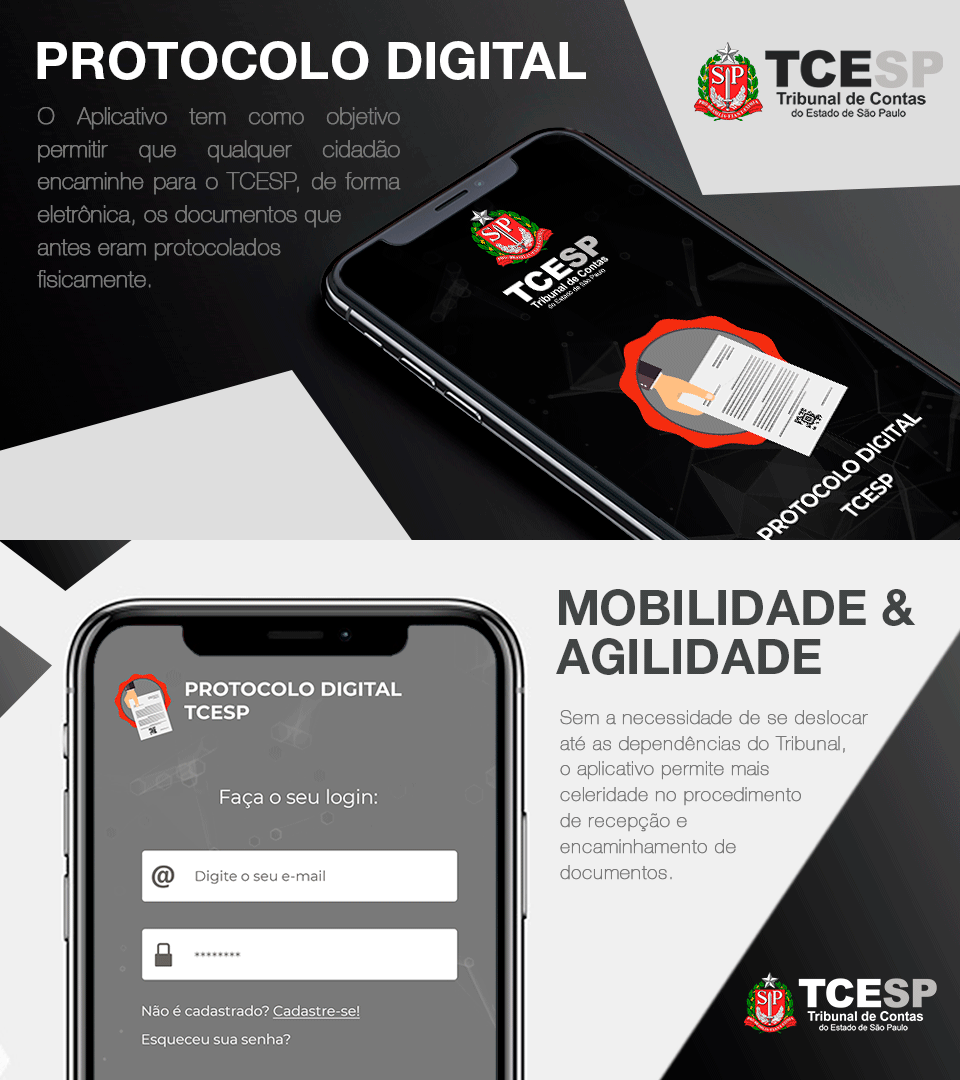
The app lets any citizen send TCESP, electronically, the documents that used to be filed in person, with no need to travel to the Court's offices. It speeds up the process of receiving and routing documents.

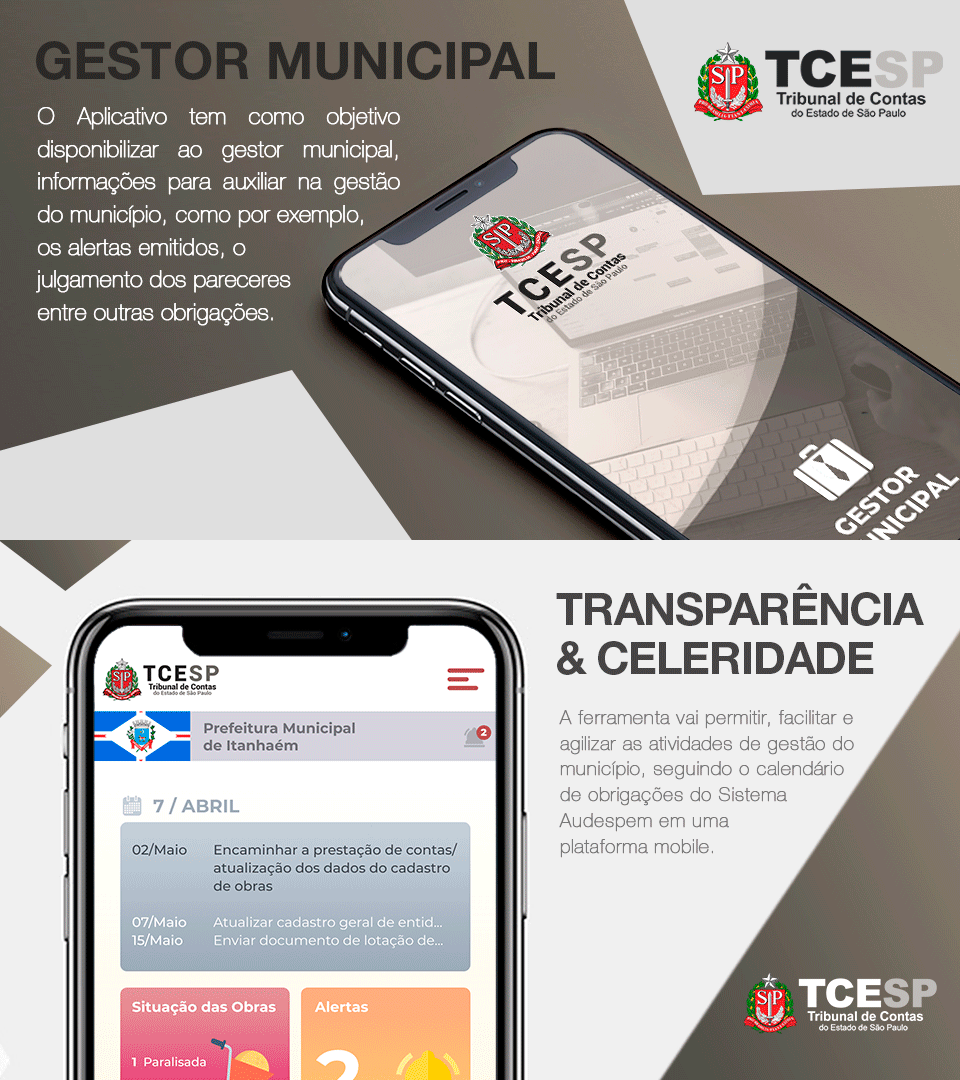
We developed a mobile app that makes municipal management activities easier and faster. The project's goal is to give municipal managers information that helps them run the municipality, such as issued alerts, rulings on opinions and the Audesp System's calendar of obligations, among others.

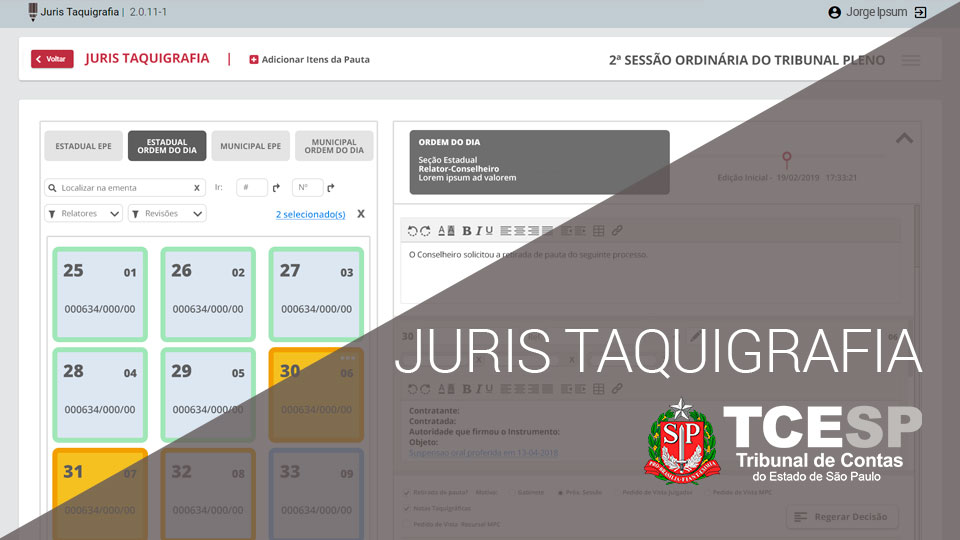
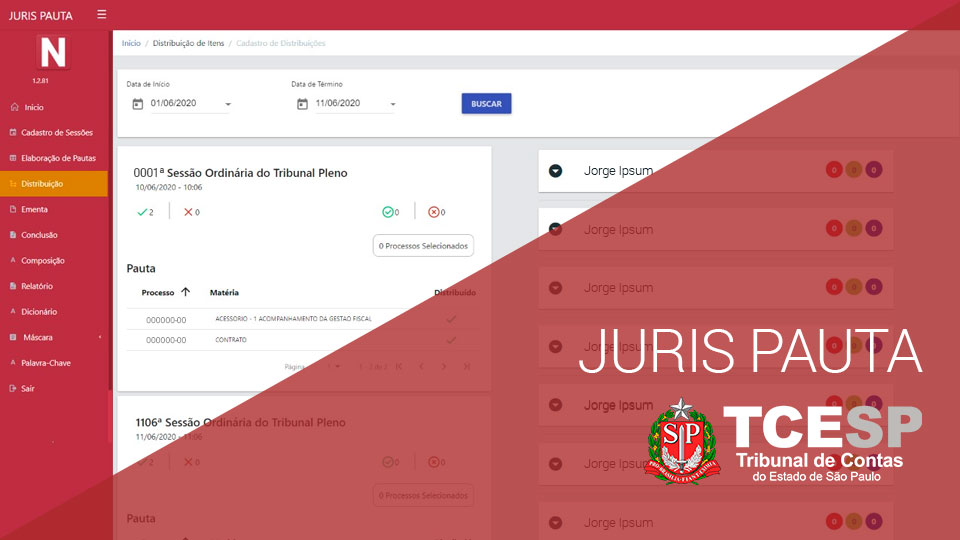
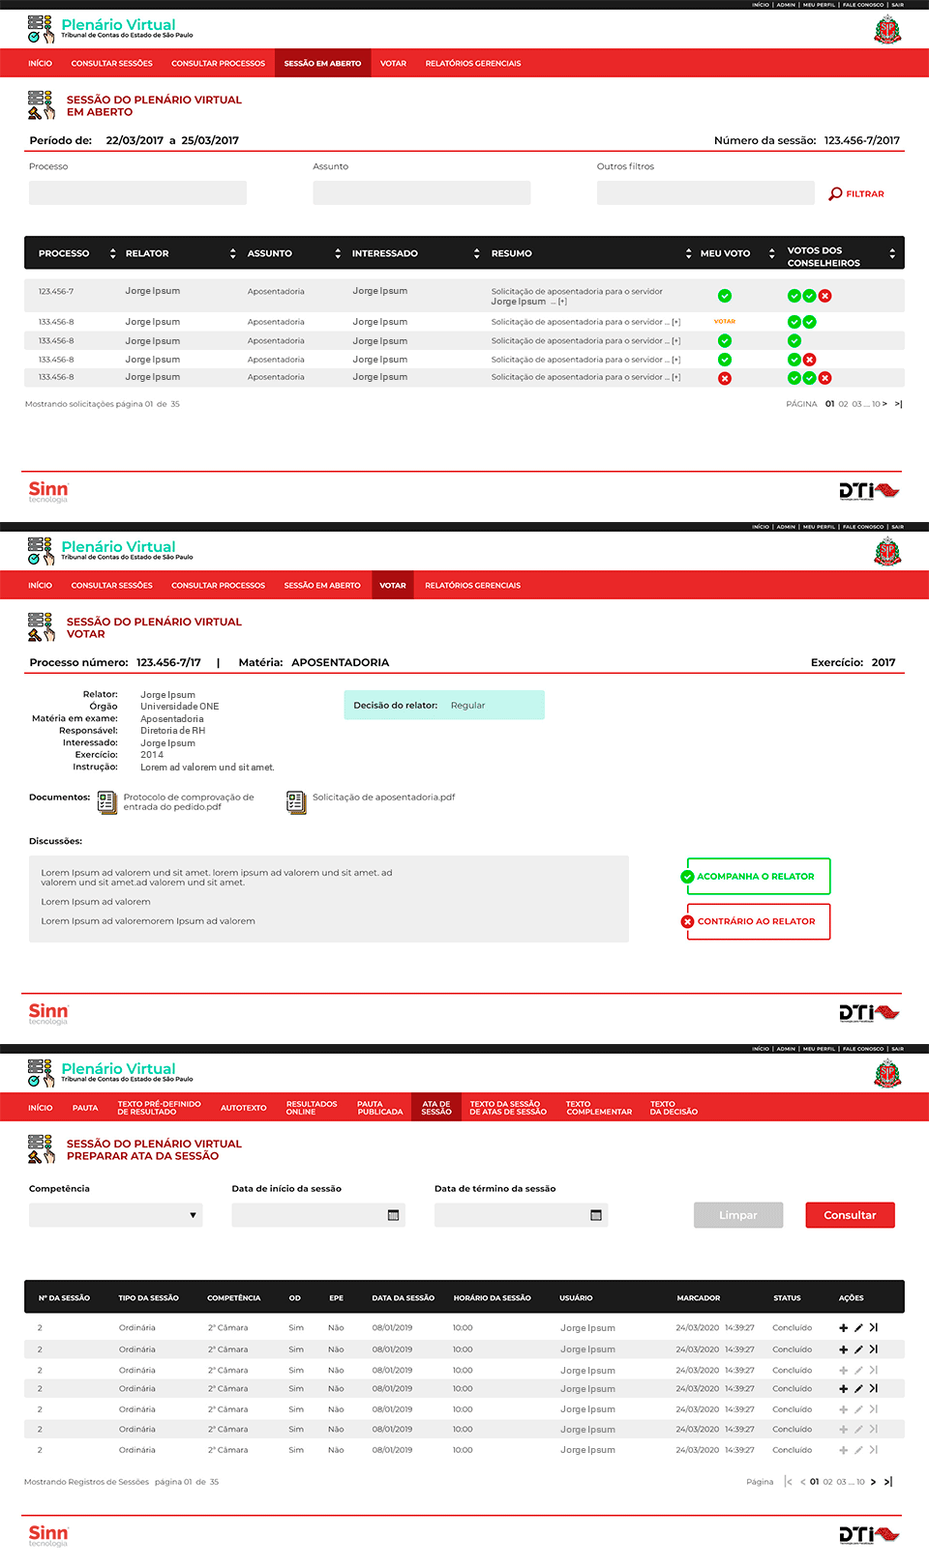
The Virtual Plenary project was born during the COVID-19 pandemic, out of the need to keep the important work of TCE-SP going. Our team came together and, in 4 (four) days, delivered the system that automates voting and the tracking of agendas and sessions.

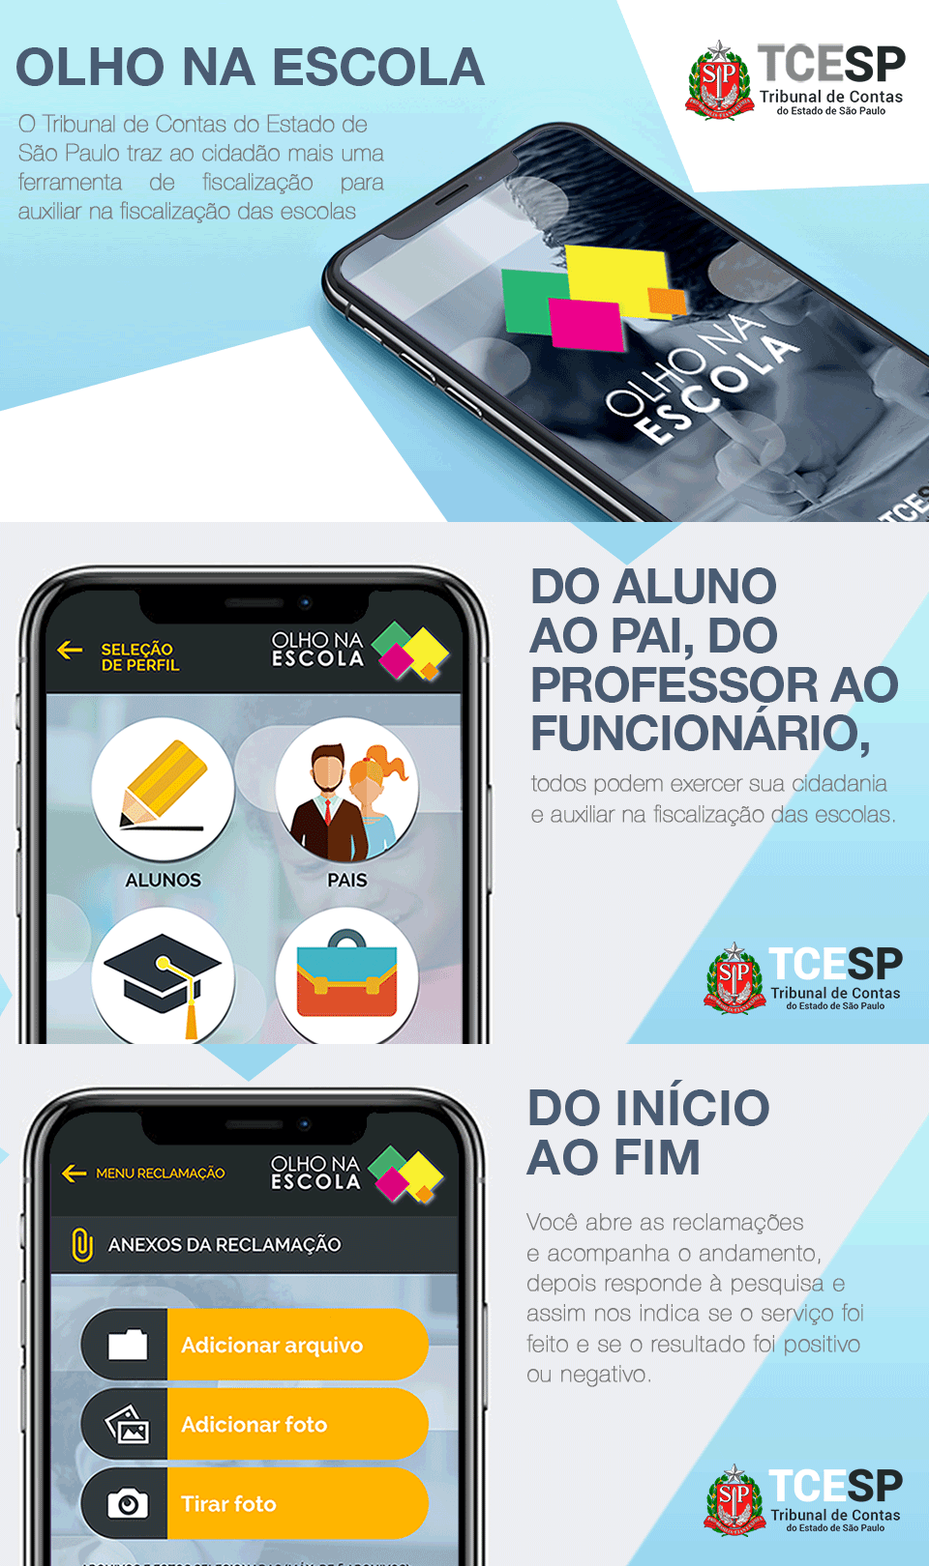
We are very proud to have developed the 'De Olho na Escola' app together with TCE-SP. Its purpose is to give the public a tool to monitor and oversee public schools across the state.

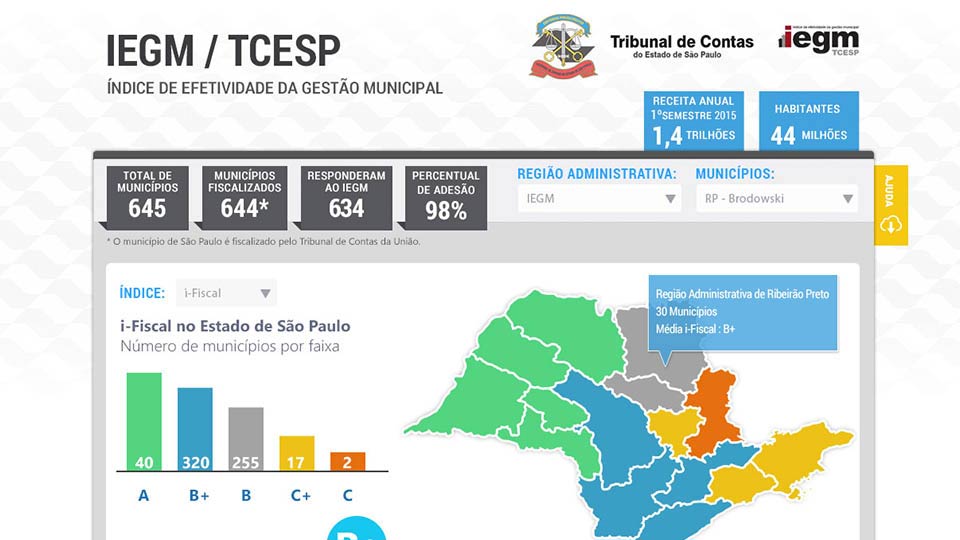
The IEGM / TCE-SP dashboard gives residents of the state of São Paulo visibility into the management of every municipality in the state. The goal was to automate the oversight, analysis and evaluation of São Paulo's municipalities through the IEGM / TCESP dashboard - Índice de Efetividade da Gestão Municipal (Municipal Management Effectiveness Index).

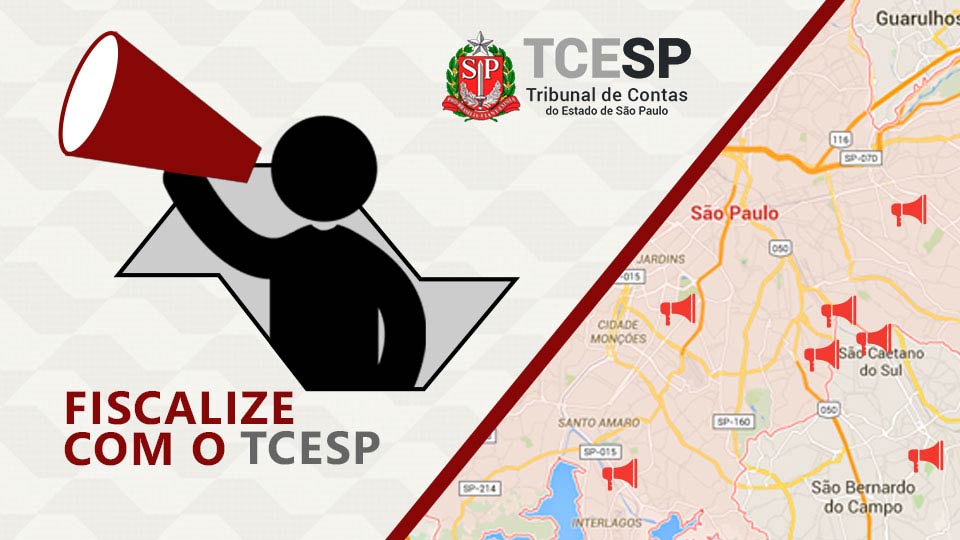
Another important project is the Fiscalize com o TCE-SP app. Broadly speaking, it is a tool built so the Court's inspectors can carry out their field work more efficiently, overseeing different aspects of São Paulo's municipalities.

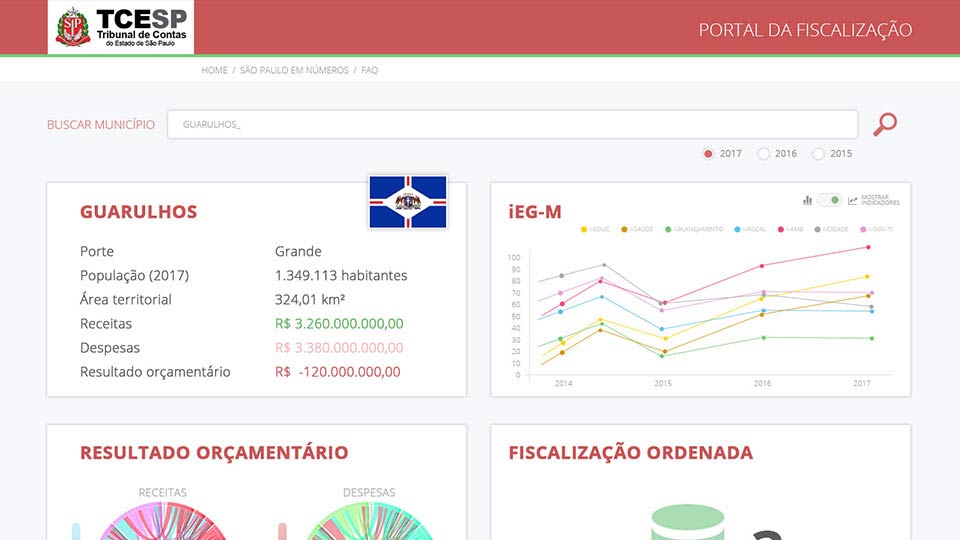
Likewise, the oversight portal offers an important set of performance indicators for São Paulo's main regions.

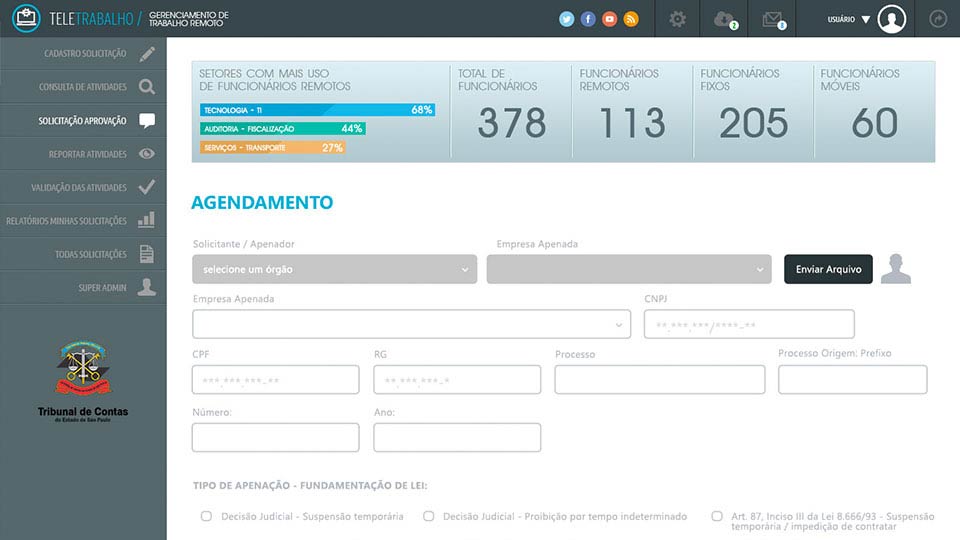
TCESP's Telework system provides internal control over the new remote-work model regulated by the federal government after the CLT (Brazilian labor code) was relaxed. The tool applies an efficient, organized management model, making it easier to plan and properly allocate the agency's staff.

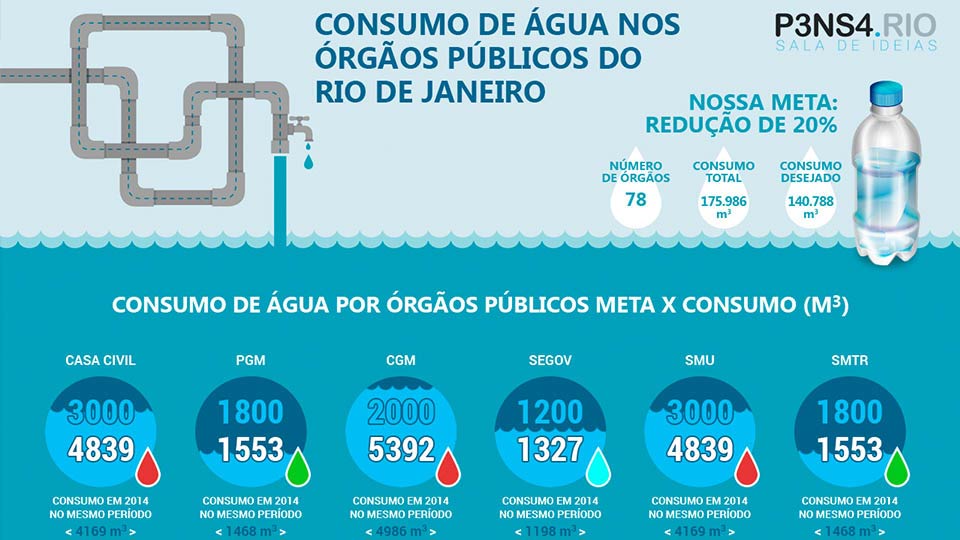
The water consumption dashboard was conceived at the request of Rio de Janeiro's mayor during the city's water crisis. It reported, in real time, the water consumption of each public agency.

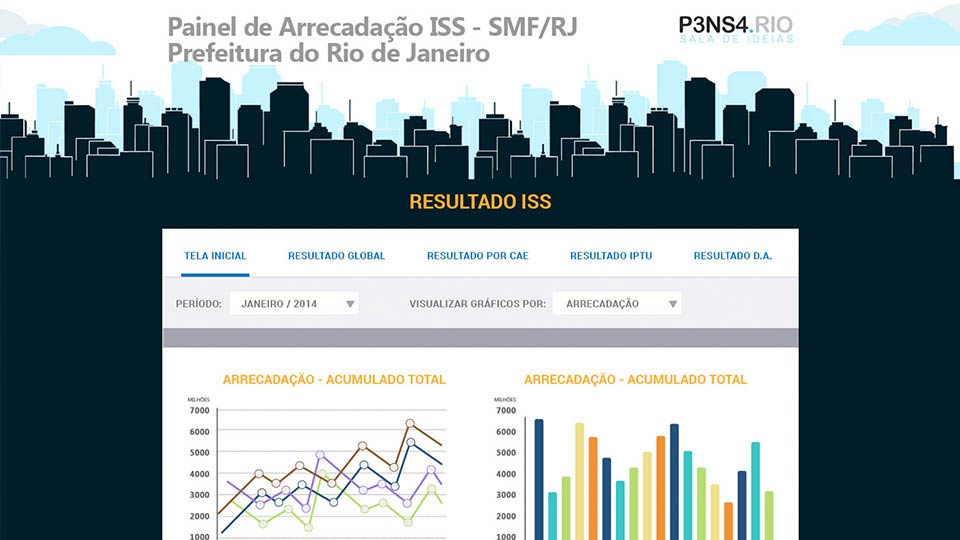
The revenue dashboard was created to track, monthly and yearly, the ISS (municipal service tax) collected by the City of Rio de Janeiro, comparing projected and actual revenue and flagging deviations based on the metrics set by SMF/RJ.

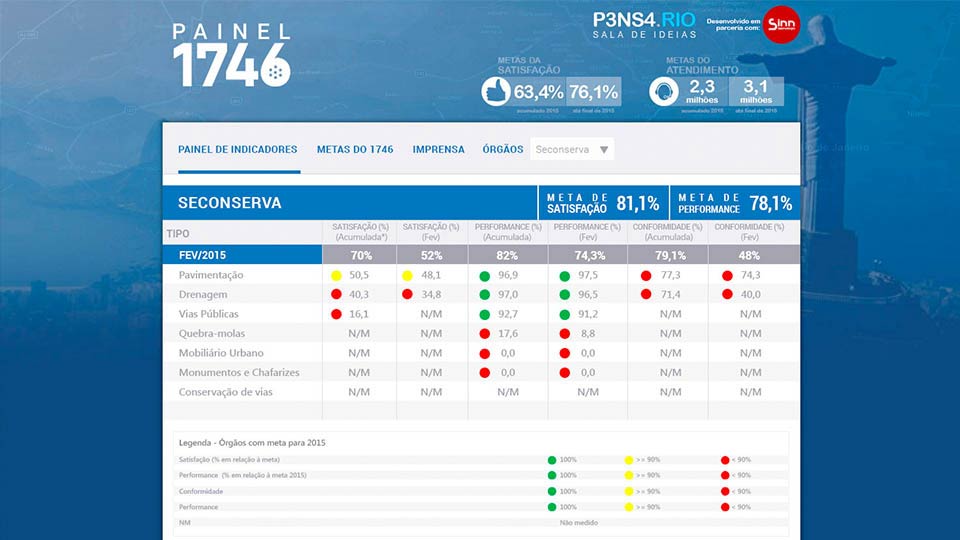
The 1746 dashboard was developed to give the city hall's management bodies real-time access to the indicators used by the 1746 system. The goal was to increase internal data transparency, enabling information from the mobile app to be shared.

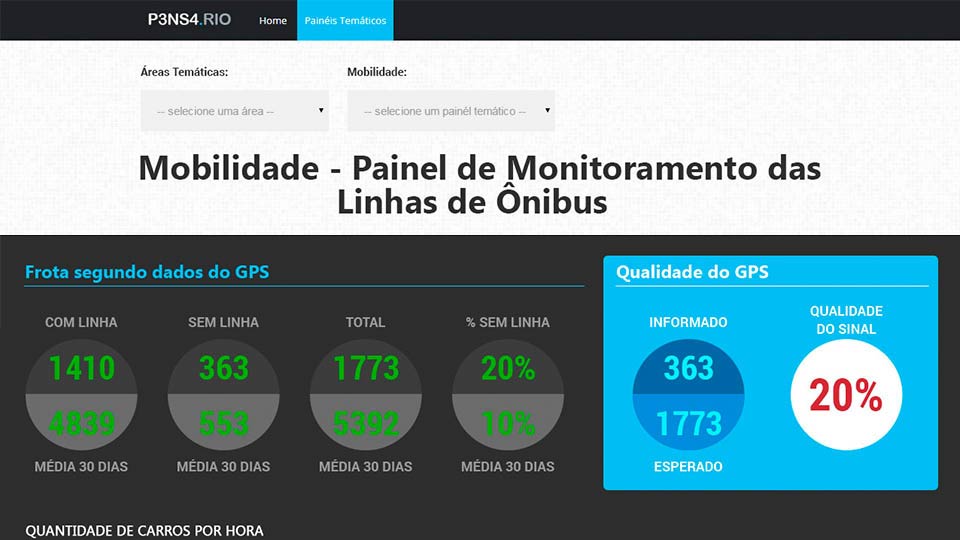
The urban mobility dashboard was created at the request of the Rio de Janeiro City Hall to track, in real time, indicators related to vehicle traffic in the city.

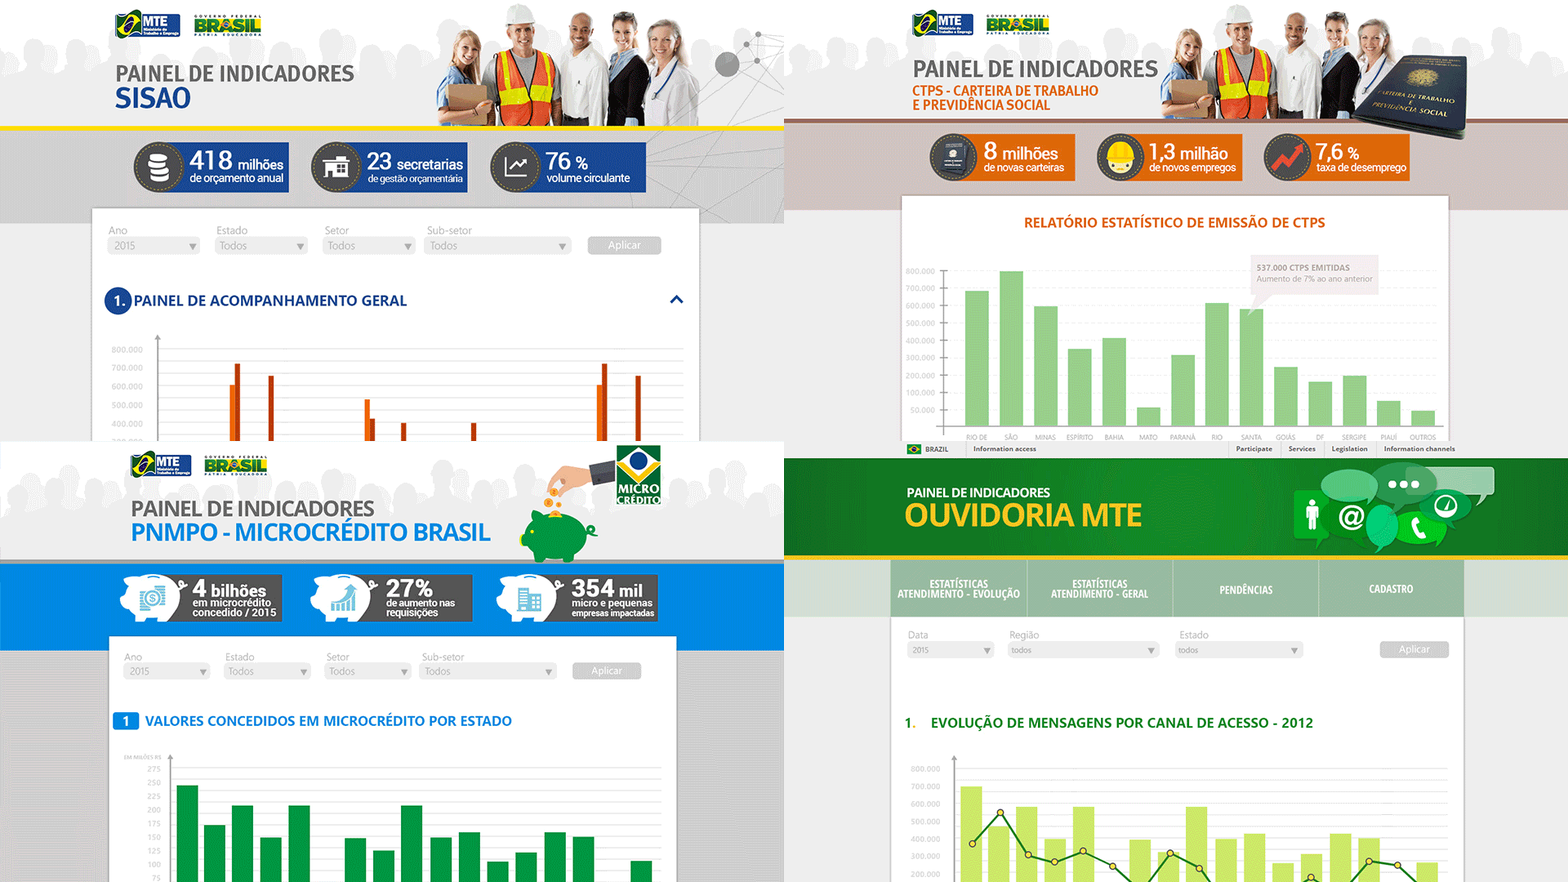
The project was created for four departments of the MTE (Ministry of Labor and Employment). These indicator dashboards reported key data on employment and unemployment, migrants and immigrants, the ombudsman's office and the ministry's internal finances.

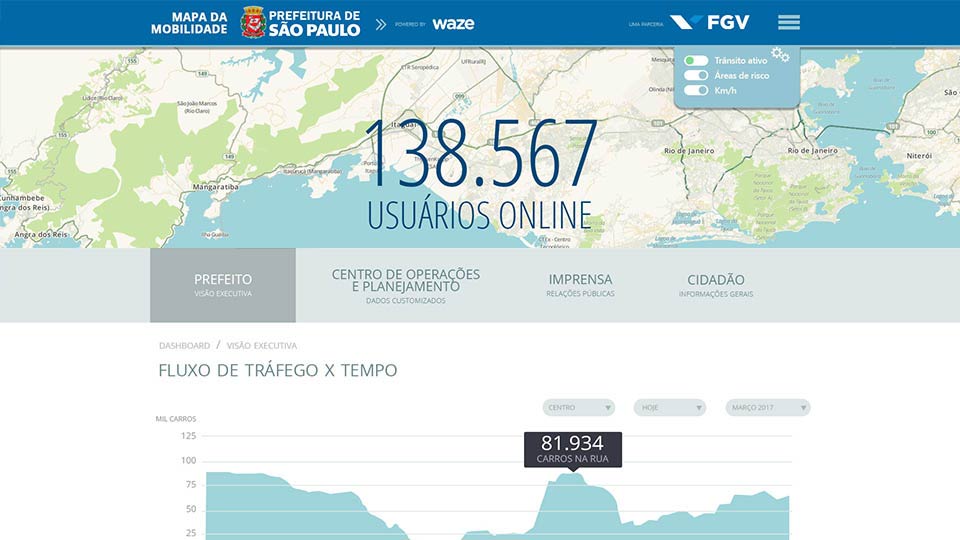
A BIG DATA project carried out together with WAZE, focused on analyzing the app's alert data in search of behavioral patterns and insights for Smart City solutions.

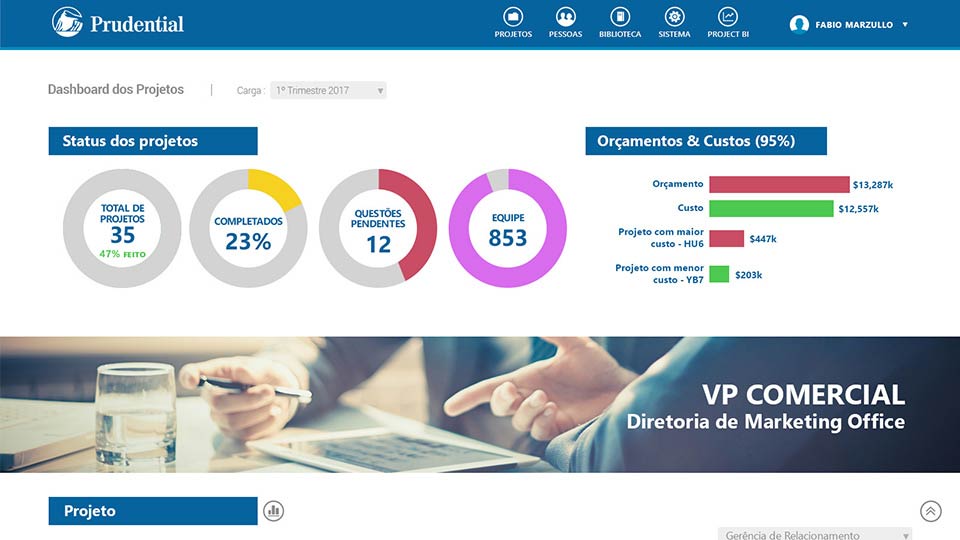
Prudential's project management dashboard offers a holistic view of the PMO and its internal initiatives, focusing on its own KPIs and PMI's.

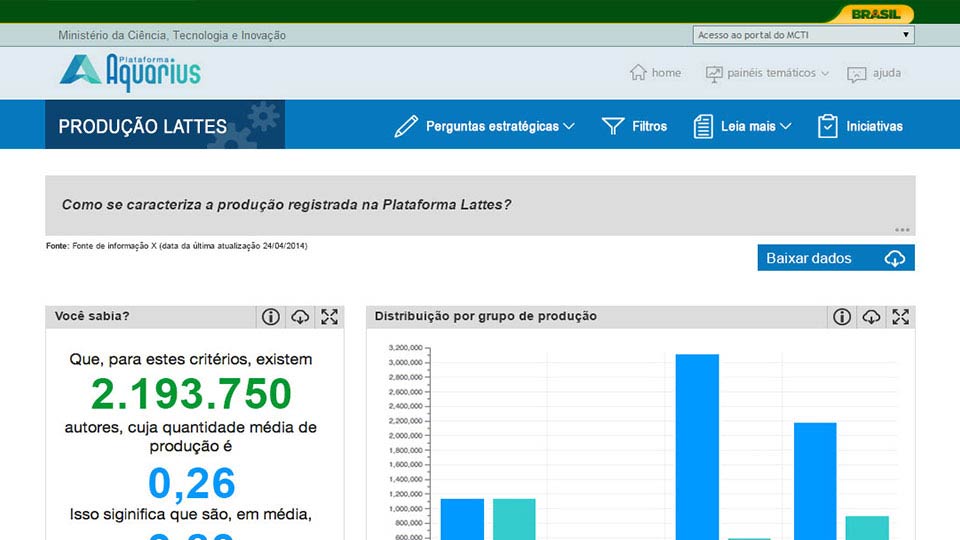
The challenge was to build a dashboard for the Ministry of Science, Technology and Communications, focused on managing more than 50 million CNPQ research records.

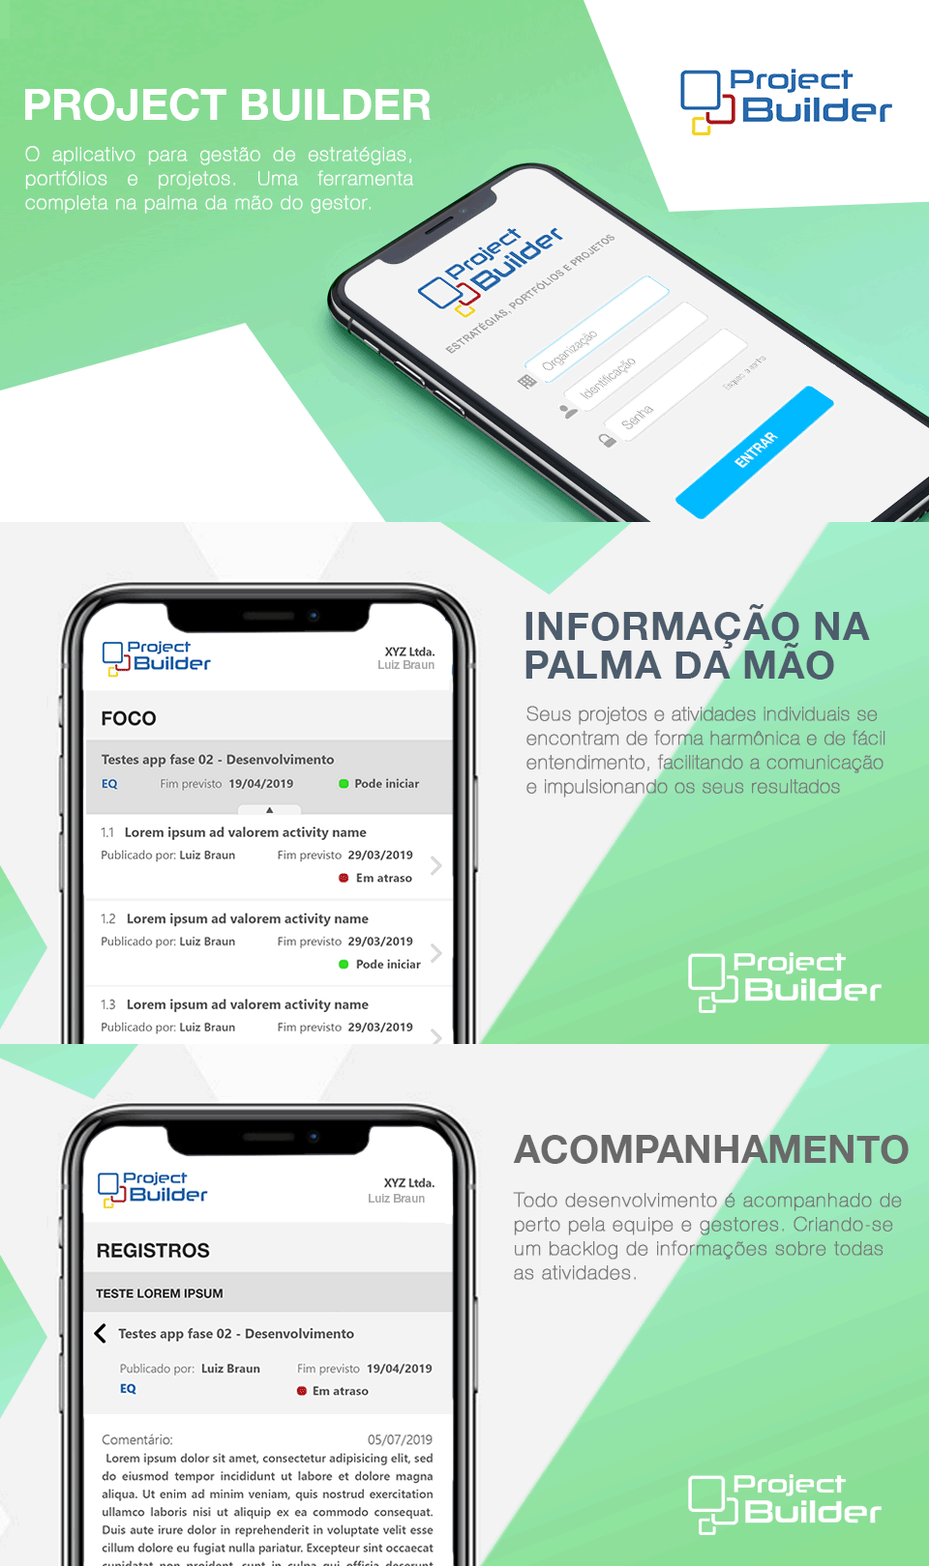
Project Builder APP was developed for one of Sinn Tecnologia's major partners, Project Builder, and provides mobile access to the SaaS or on-premises system.

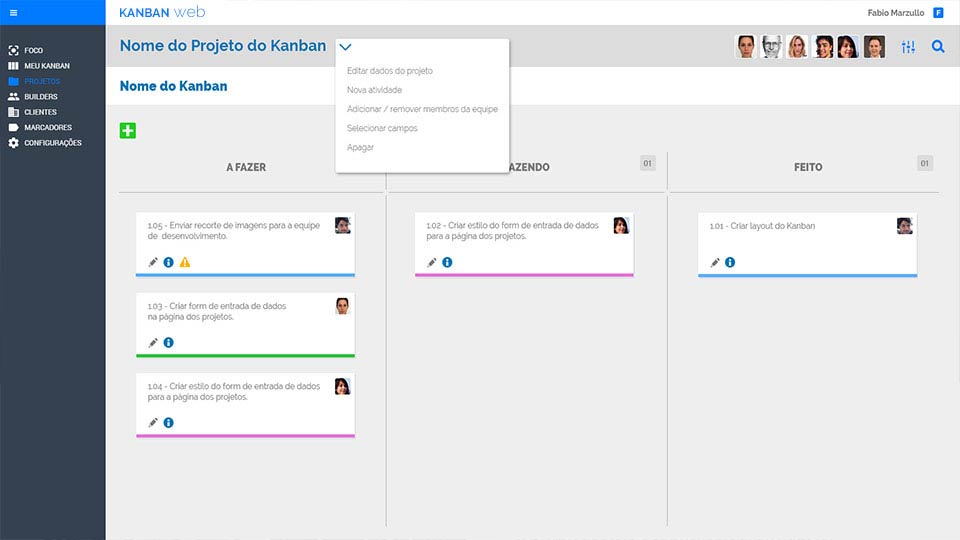
Kanban ML was built with Machine Learning technology and can watch a real Kanban board through a video camera, identifying and tracking the project's tasks as they move across the To-Do, Doing and Done lanes.

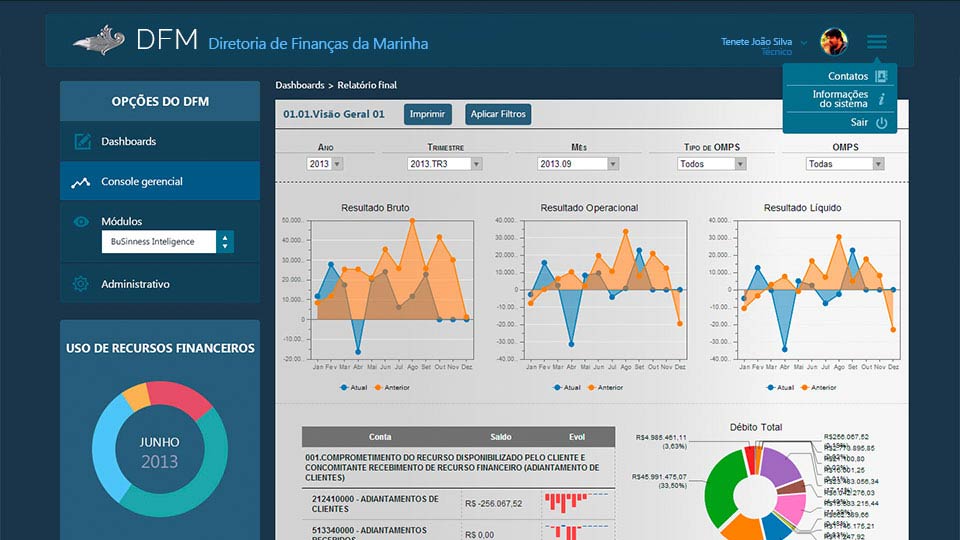
Another project developed together with COPPE/UFRJ and the Brazilian Navy's Finance Directorate, in which we built a dashboard to manage the financial indicators of every Military Organization.

A project developed together with COPPE/UFRJ for the Brazilian Navy's Finance Directorate, for the internal management of that Military Organization.

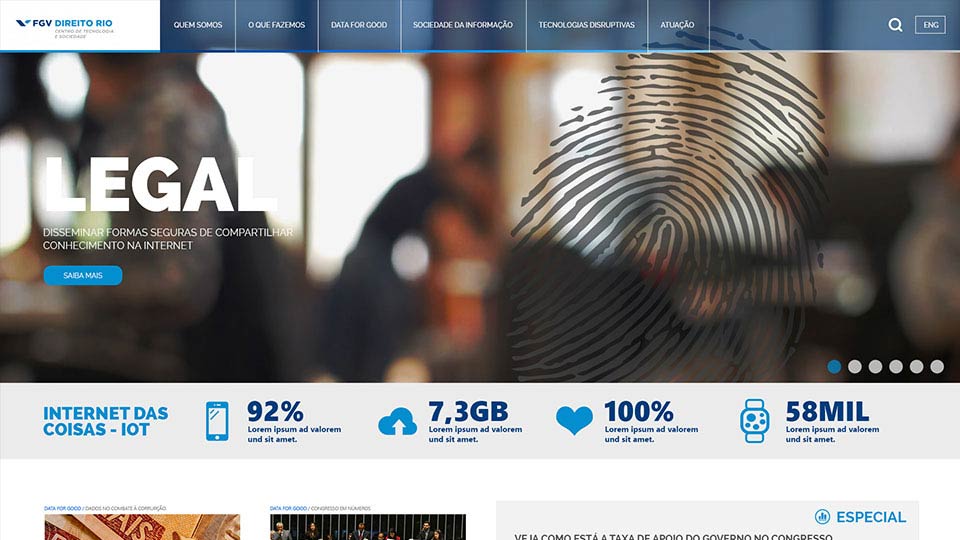
FGV's CTS portal was developed to share news about the activities of the Center for Technology and Society (CTS) at FGV DIREITO RIO.

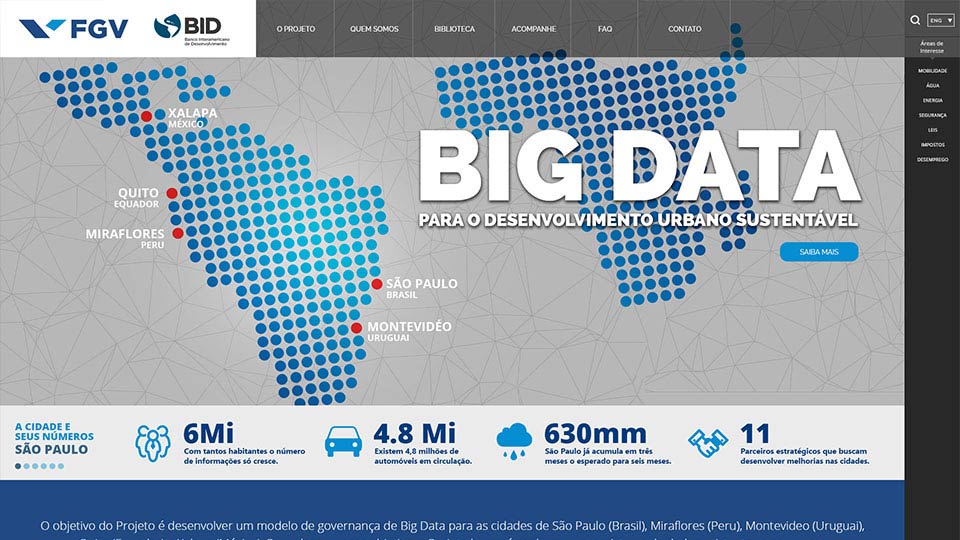
The portal for the joint IDB (Inter-American Development Bank) and FGV project was created to keep the public informed about the progress of the institutions' Smart Cities project.

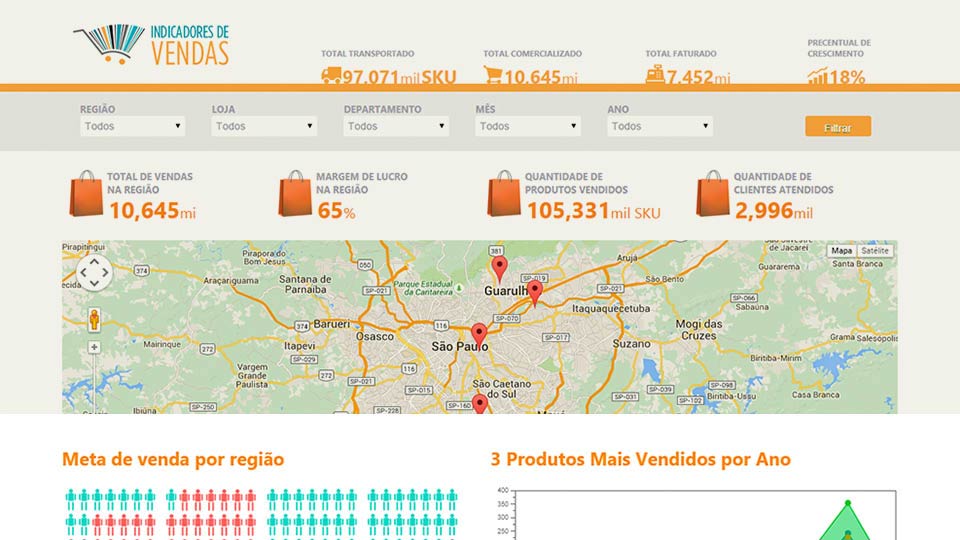
The retailers dashboard focuses on a store's product sales indicators. Built generically, it can adapt to any sales system in any retail segment.

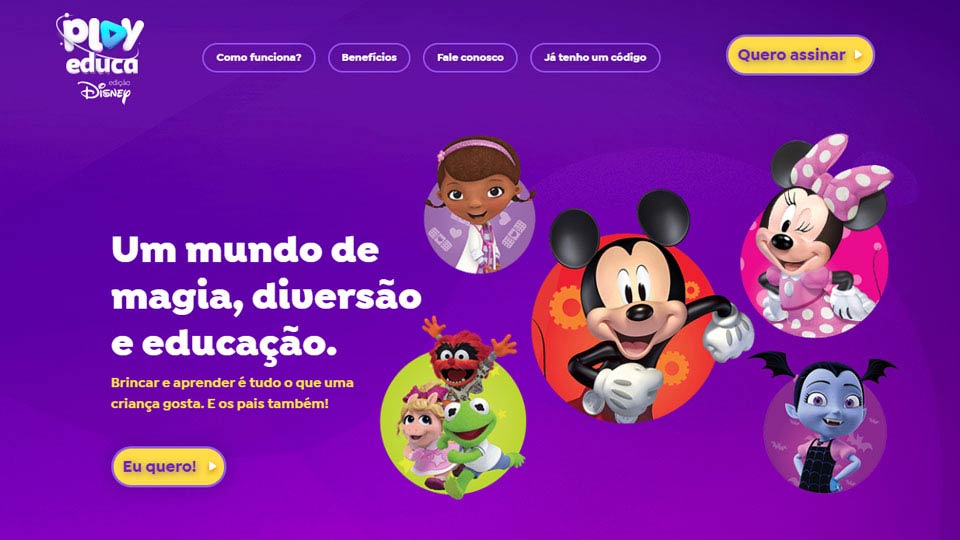
A world of magic, fun and education. Playing and learning are what children love most. And so do their parents! Developed in partnership with Arcolabs (www.arcolabs.studio), the project offers activities created by Brazilian educators according to the Ministry of Education's (MEC) National Common Curriculum Base for preschool. They entertain children while building the skills they need to learn to read and write. Discover the platform at www.playeduca.com.br

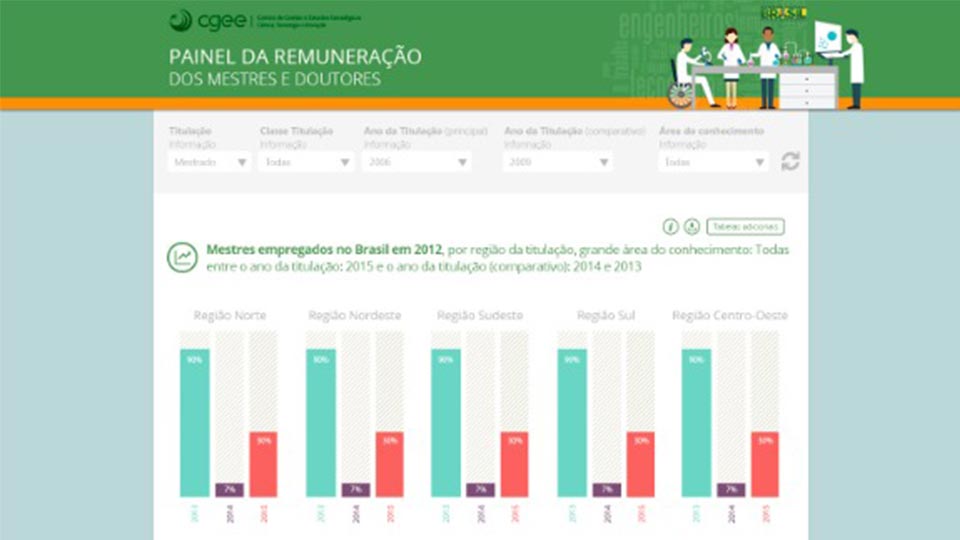
The RHCTI project was developed in partnership with CGEE to create an interactive dashboard that brings transparency to compensation data for professors and researchers. Built with Pentaho, Java and a PostgreSQL database.

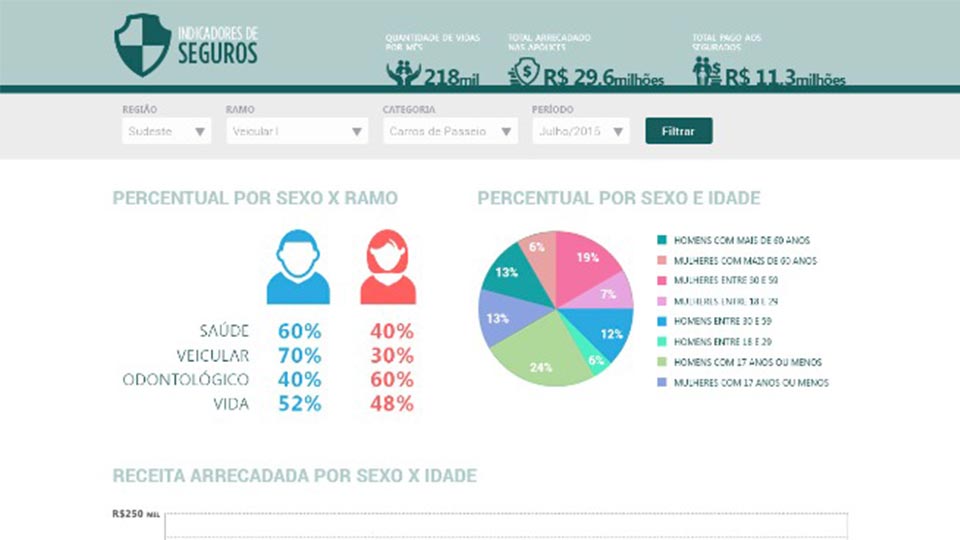
Like the retail dashboard, the insurance indicators dashboard offers a holistic, thematic view of the sector's key indicators. Sinn built it generically so it can be customized for any company in the industry.

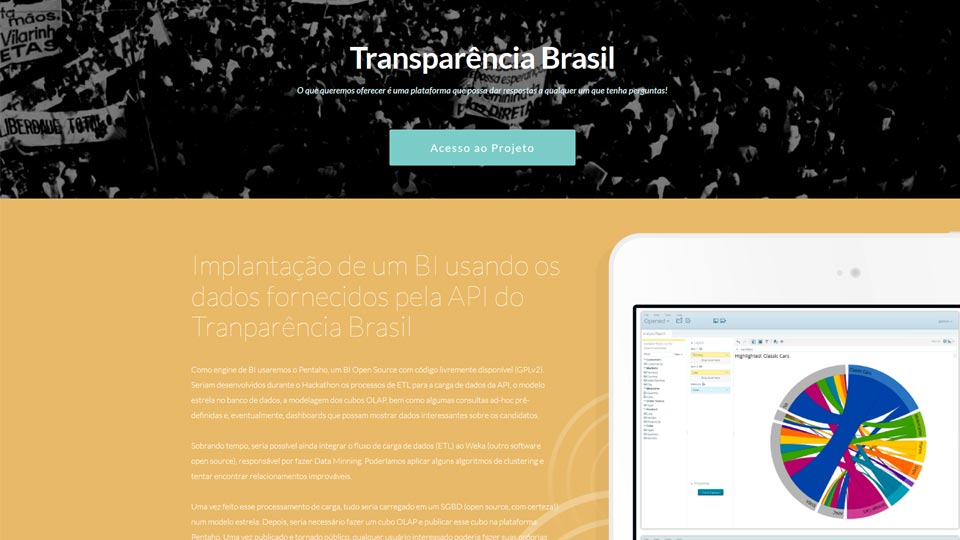
Sinn Tecnologia took second place in the Google Hackathon with a data solution for the Transparência Brasil portal. By consuming the project's API, we built dashboards with key information and data cross-referencing, focused on public tenders and loans.

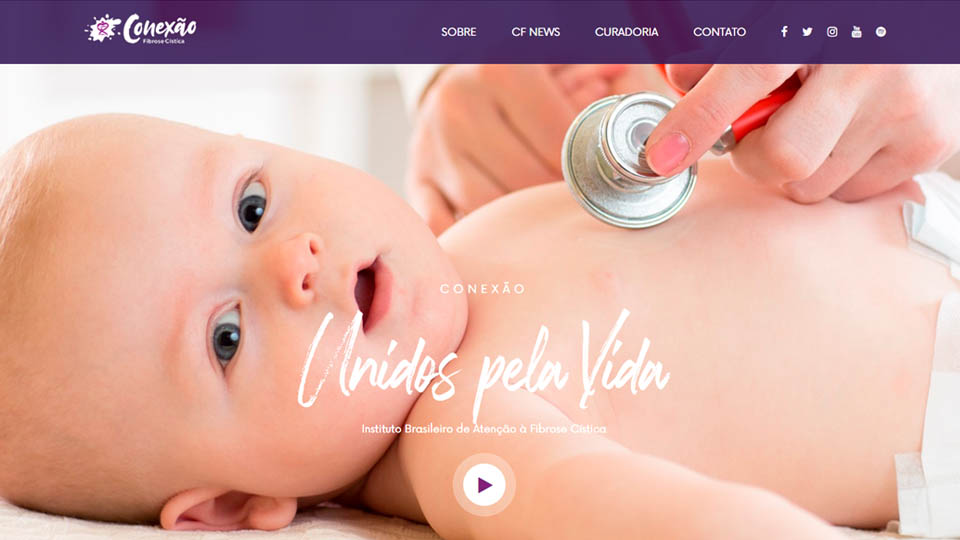
Sinn Tecnologia developed the website and management system for the nonprofit Conexão Fibrose Cística, which raises awareness of and supports research on cystic fibrosis, and has helped hundreds of thousands of families over the years.